Calculate and Print Projected Subject Enrolments {RPOPS-4} / {RPMAIN-1-4}
This program enables the user to do simple projections on the data, in
other words, project future years’ subject enrolments by applying the
projection percentage parameters from {RPOPS-3} to the enrolment
information in {RPOPS-2}.
The program calculates projections on the data, starting with the actual
values in the year supplied as Base Year input parameter. For example,
if the Rolling Plans are calculated for 2000, 2001 and 2002, then the
Base Year that should be supplied is 1999. The actual enrolments for 1999
are then used as a basis to forecast values for the following 3 years,
by using the percentages specified as the projection parameters in
{RPOPS-3}. The default percentages for the institution (on Block 1 of
{RPOPS-3}) should be used for all departments’ projections, unless
percentages are specified for the specific department (in Block 2 of
{RPOPS-3}).
The program starts by zeroing all values in the
field “Projected Headcount” of {RPOPS-2}, in order to “wipe out”
previous projections and so as not to contaminate the projections. The
program then calculates projected enrolments and writes it only to the
“Projected Headcount” field. The “Final Headcount” figures on
{RPOPS-2} will not be overwritten, unless the user specified by the
user that the same values should also be copied to the final student
headcount field (using a ‘Y’ as input parameter at the appropriate
question).
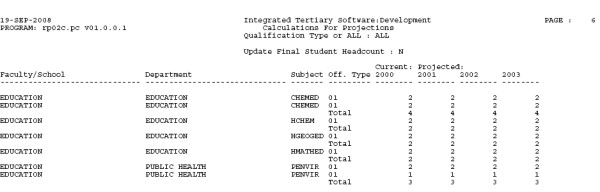
The program prints out a list of the Base Year’s
actual headcount values, as well as the projections for all the
following three years, i.e. print all projected values for all three
years. This list is ordered per Faculty, Department, Subject Code and
Offering Type and gives the values for each year next to one another.
Totals are supplied for each subject.
This program can be run
more than once. The user can run the report, adjust or add to the
projection parameters and repeat the process until satisfied with the
projection figures. Then the values can be copied to the Final
Headcount values, from where the user can make small final adjustments.
Note that the selection in the Faculty and Department codes makes it
possible to fine-tune the projections per individual faculty or
department separately
| User Selection |
Prompt Text
* an item between square brackets [ ] is the default
answer |
Type
&
Length |
Comments |
|
Enter Base Year for Rolling Plan. |
N4 |
x |
|
Copy projections to Final Student Headcount? (Y/N). |
A1 |
|
|
Is This a (T)rial or (U)pdate Run (T/U)? |
A1 |
|
|
Enter Faculty Code to Include or ALL. |
N4 |
|
|
Enter Department Code to Include or ALL. |
N4 |
|
| Sort Order |
Per |
Comments |
|
Faculty and School. |
x |
| System Select |
|
|
No special system selection. |
Example:
Processing
Rules |
|
| |
No special processing rules. |
See Also:
History of Changes
| Date |
System Version |
By Whom |
Job |
Description |
| 29-May-2008 |
v01.0.0.0 |
Charlene van der Schyff |
t145483 |
New manual format. |
| 19-Sep-2008 |
v01.0.0.0 |
Charlene van der Schyff |
t151627 |
Edit language obtained from proof read language Juliet Gillies. |