Student Application Information: Admissions vs Applications_m21dis


Management Report:


 Student Information    Student Applications: Click on: Admissions vs Applications   

This Dashboard displays summarised data from the live transactional database. The number of Applicants and Admissions can be seen by Selecting an Academic Year (user selection filter) and information will be displayed for the consecutive years selected.


Example of m21dis

Example of ...Student Applications


Academic Years The user can select any YEAR from the Dashboard under this feature, and it will populate only on the GRAPH the desired measurment.IT WILL NOT update the SHEET only the bottom list.
Faculty The user can select a FACULTY from the Dashboard, and it will populate only on the GRAPH the desired measurment.IT WILL NOT update the SHEET only the bottom list.
Graduate Type The user can select a GRADUATE TYPE from the Dashboard, and it will populate only on the GRAPH the desired measurment.IT WILL NOT update the SHEET only the bottom list.

Graph


Example of List Above.
The Summary List 
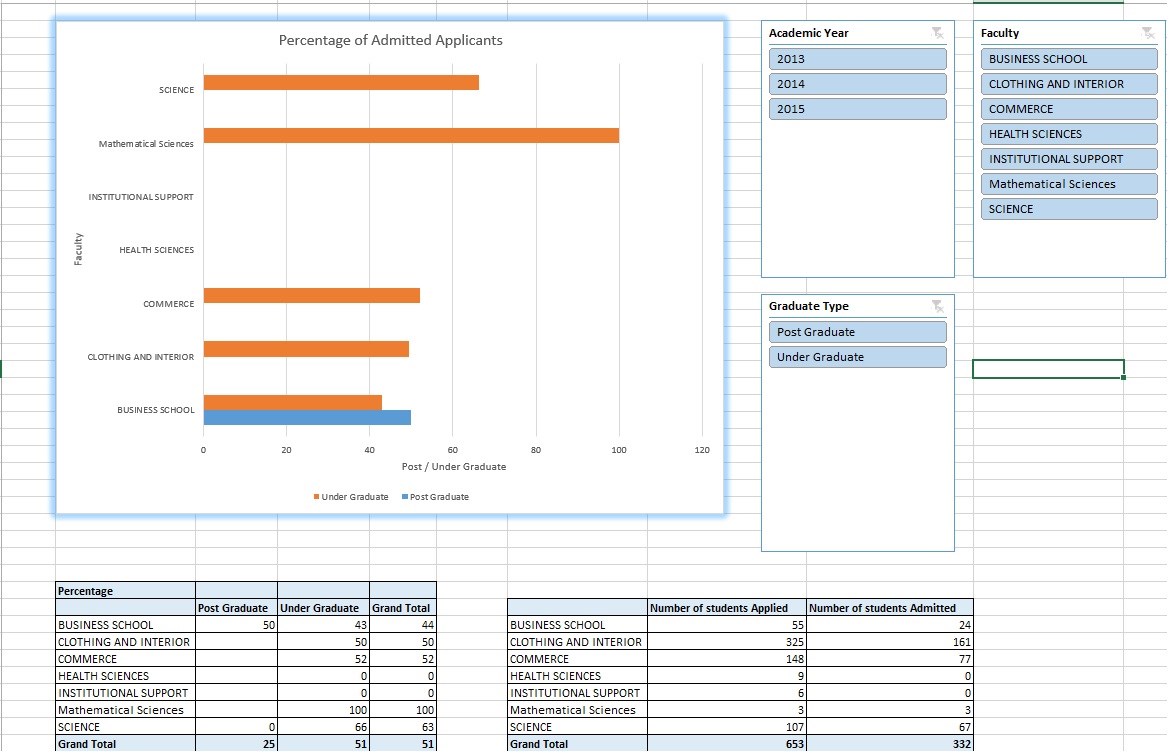
The summary list is a list that is updated each time the user alters or selects a different entity on the Dashboard.
Percentage The list updates each time a user changes the filter on the dashboad, this column displays all the Percentage of Admitted and Applied for Students.
Post Graduate This column populates if the user selects from the filter "GRADUATE TYPE" and selecting either POST Graduate. If no filter is selected then both Post Graduate and Under Graduate colunms print.
Under Graduate This column populates if the user selects from the filter "GRADUATE TYPE" and selecting either UNDER Graduate. If no filter is selected then both Post Graduate and Under Graduate colunms print.
Grand Totals This is a column that totals the filters selected. Each line is per Qualification. 
Total The Total Percentage of Graduates per Qualification.
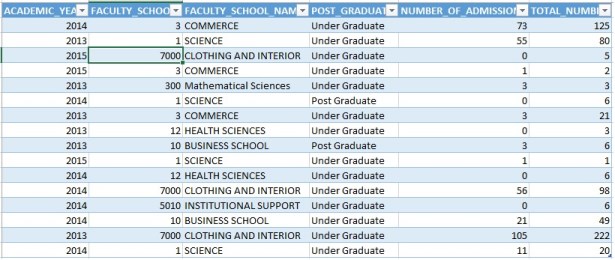
 If the user happens to be selecting data from FACULTY, it will automatically alter the GRADUATE Type filter.  For instance if the user selects Faculty "Business Schools" and there is only "Post Graduates" in, it will automatically alter Graduate Type by selecting the Type that is available in the Faculty.
Number of Students Applied This list is updated by counting the number of Students Applied for during the specified Academic Year, in certain Faculties and both Post and Under Graduates are counted.
Nuber of Students Admitted This list is updated by counting the number of Students Admitted for during the specified Academic Year, in certain Faculties and both Post and Under Graduates are counted.
Grant Total Total of Applied Students and Admitted Students.

Example of the SHEET as per Default without filters.
The user can at any point in time, select from the drop down filters, and readjust the report to his/her desired outcome.

Listing of admissions


Example of Dashboard selected filters.
Also NOTE that the user can MOVE the Filters around on the Spreadsheet to suit there needs. By clicking on the filter next to the NAME of the filter, when the mouse poointer changes to moving the mousethe user can move the filter around.

Example of ...Explanation of Dashboard


Example of Clearing the filters.:

Example of ...Clear the filter


Please Note that if the user decides to Click "OPEN" directly, then the document in question is labled as "doexcel" this document SHOULD NOT be saved, it can be worked on.
The User will have to click on SAVE and then open the document for actual e.g mis21dis....!

Open and Save


See Also:  Management Reports


History of Changes

Date System Version By Whom Job Description
26-Feb-2015 v03.0.0.0 Charlene van der Schyff t205595 New Online Manual for: Student Application Information: Admissions vs Applications_m21dis_date.xlsx