 |
This report is used to display detail on students linked on Maintain Students at Risk {SSTUDTO-2} for 'A'cademic Risks linked to the Risk Level Indicator = 'A'ssessments on {SSTUDTC-3}. The detail will be displayed according to:
The report will be extracted onto EXCEL, but an csv file will also be created on the directory according to the set up for the combination System = 'STUD' and function "STSAA' on {SSTUDTM-4}.
| User Selection | Prompt Text * an item between square brackets [ ] is the default answer |
Type & Length |
Comments |
|---|---|---|---|
| Enter Academic Year | YYYY | ||
| Enter Faculty Code or ALL | N4 | Faculty linked to the subject on {SACAD-14}. | |
| Enter Department Code or ALL | N4 | Department linked to the subject on {SACAD-14}. | |
| Enter Personnel Number or ALL | N9 | ||
| Enter Run Sequence Number or ALL | N10 | ||
| File Path/Directory | A80 | The Path of the File Location, will default as set on {SSTUDTM-4}. | |
| Enter File Name | A80 | The Actual File Name is Entered here, will default to {SSTUDTM-4}., but may be changed. to another *.csv file name. |
| Sort Order | Per | Comments |
|---|---|---|
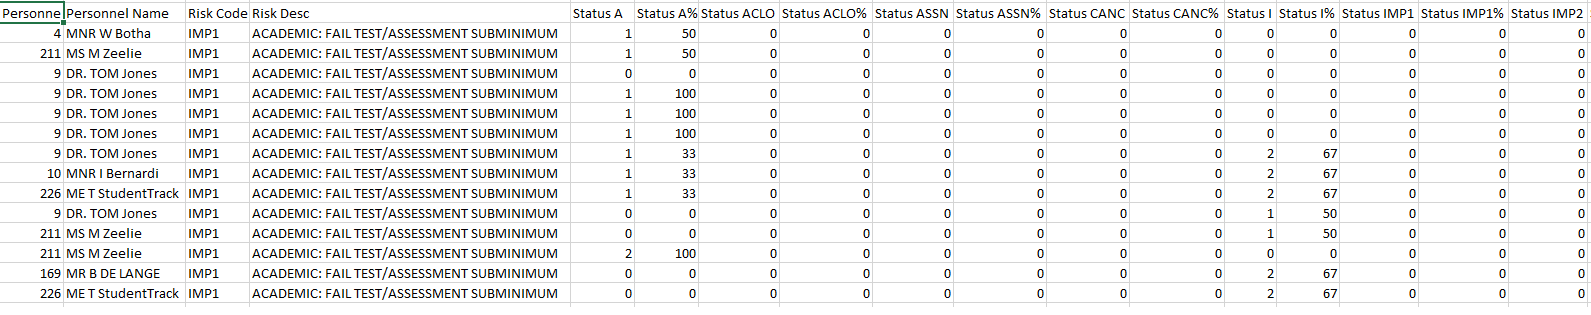
| Campus Code, Per Faculty, Department, Subject Code, Offering Type, Group Type, Mark Type, Mark Number, Risk Code and Personnel Number , |
| System Select | |
|---|---|
Records included, only 'A'cademic risks linked to level A on {SSTUDTO-2} and according to Role Access on {SSTUDTM-1}.
|
|
|
| Processing Rules |
|
|---|---|
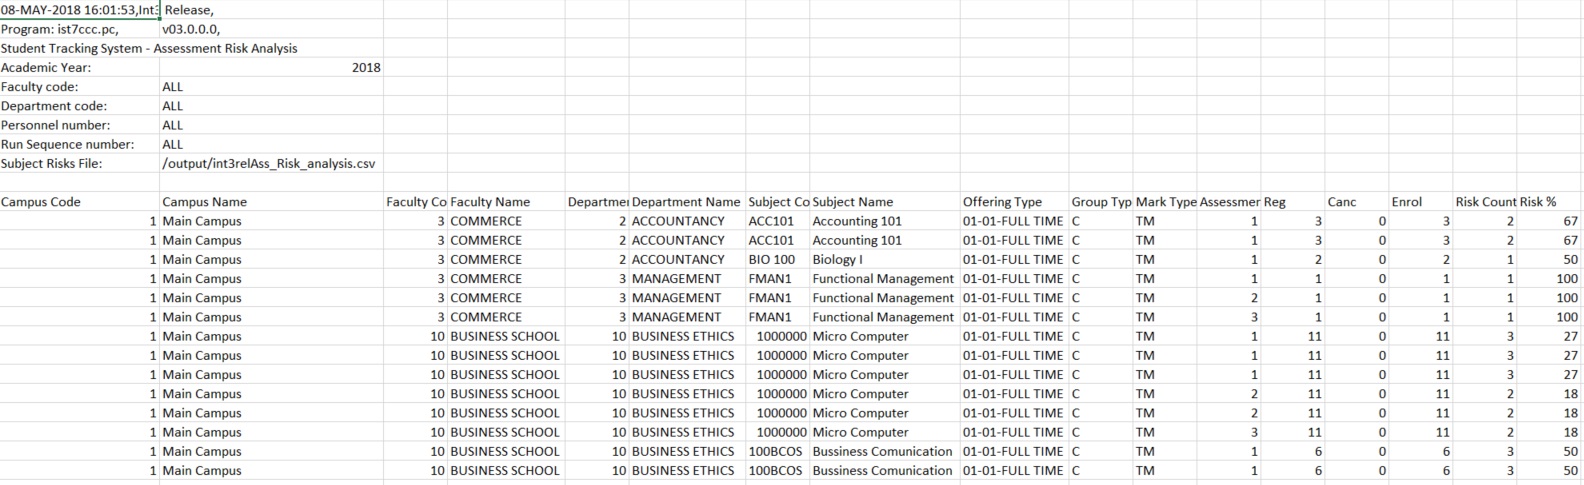
| The counts are done as follows: Registrations Count students registered for the Subject and Offering Type on block codes Exam Only = N Cancellations Count students registered for the Subject and Offering Type on block codes Exam Only = N where cancellation date is not NULL Enrolments Registrations - Cancellations Risk Count Count the number of records at risk out of the Enrolments Risk % The number at risk Risk count/Enrolment *100 Count Status Count the number of records on each status Status % Count Status/Risk Count * 100 |
| Date | System Version | By Whom | Job | Description |
|---|---|---|---|---|
| 4-May-2018 | v03.0.0.0 | Melanie Zeelie |
t227269 | New option new manual. |